PIP5K1A
phosphatidylinositol-4-phosphate 5-kinase type 1 alpha


These figures show a summary of data collected by the cancer genome atlas for PIP5K1A. The mutations heatmaps shows the fraction samples with each type of genetic mutation, while the copy number variation shows the percentage of samples where a deletion or amplication was dectected. Finally, the mRNA expression tab shows the amount of mRNA detected on a log-2 scale for each cancer type. The X-axis cancer type abbreviations are described here. This summary of the cancer genome atlas (TCGA) was collated from firebrowse developed by the Broad Institute. The code used to produce these figures is available through github.
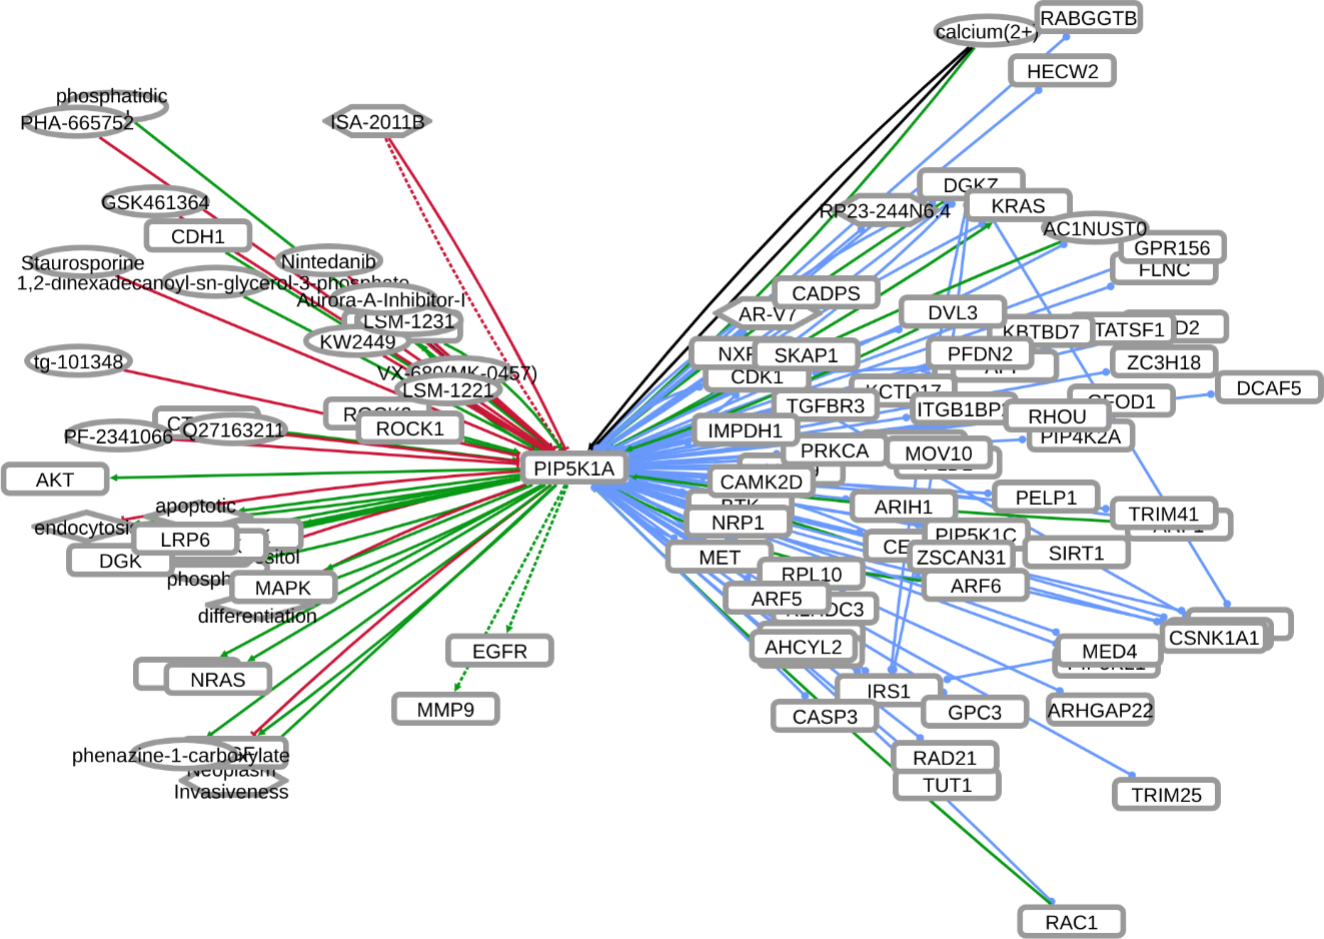
INDRA (Integrated Network and Dynamical Reasoning Assembler) is an automated model assembly system drawing from natural language processing systems and structured databases. It collects mechanistic and causal assertions, represents them in a standardized form (INDRA Statements), and assembles them into various modeling formalisms including causal graphs and dynamical models. More information on this work can be found on Github. In this particular figure, several interaction-types are depicted; physical complexes (blue), phosphorylation (black), and general up- or downregulation (green and red, respectively). Biomacromolecules are represented as squares, small molecule as circles, and biological processes and diamonds. The thickness of each line reflects a confidence score, with thicker lines higher in confidence.
Affinity Purification - Mass Spectrometry

The calibration reverse curve plot with linear robust regression analysis is shown [1]. The observed concentrations of the stable isotopically labeled peptide surrogate was obtained for each peptide using LC-MS in parallel reaction mode with a constant quantity of natural isotope abundance peptide as the internal standard (25 fmol/µL) [2]. The analyte matrix was a tryptic digest of pooled patient derived xenografts (1 µg/µL) that was prepared according to CPTAC-SOP. Each of the three most intense peptide fragment ions is depicted as a different symbol. The measurements from replicate LC-MS analyses are depicted as the same symbol [3] The LOD was determined using a non-parametric method with eight LC-MS analyses without added analyte [4]. The LOQ was generated from the LOD [5]. The plots are dimensioned such that the theoretical line is at a 45° angle to facilitate assessment of peptide recovery and performance. The LOD, LOQ, and regression parameters are summarize in the Table.
- https://www.ncbi.nlm.nih.gov/pmc/articles/PMC2855883/
- https://www.ncbi.nlm.nih.gov/pmc/articles/PMC3494192/
- https://proteomics.cancer.gov/sites/default/files/assay-characterization-guidance-document.pdf
- http://clinchem.aaccjnls.org/content/50/4/732
- “Algorithms, Routines and S Functions for Robust Statistics” (CRC Press, Boca Raton, Florida, USA, 1993)
View Peptide Parameters
The expression of kinases varies widely across the human tissues assayed by the GTEx project and the Human Proteome Map. To gain a better understanding of the kinase tissue distribution, we've created an application that describes and summarizes the expression of each dark kinase in the context of the rest of the kinome. This interactive window onto the full applications shows the data associated with PIP5K1A. The graph summarizes the expression of the kinase across all the organ systems.
The full application can further explored at the Kinase Expression Data Application.
The Reactome Knowledgebase of Human Biological Pathways and Processes is a curated and peer-reviewed knowledgebase available online as an open access resource that can be freely used and distributed by all members of the biological research community. This view of the reactome database is focused on PIP5K1A and displays the pathways associated with PIP5K1A.
