MARK3
microtubule affinity regulating kinase 3


These figures show a summary of data collected by the cancer genome atlas for MARK3. The mutations heatmaps shows the fraction samples with each type of genetic mutation, while the copy number variation shows the percentage of samples where a deletion or amplication was dectected. Finally, the mRNA expression tab shows the amount of mRNA detected on a log-2 scale for each cancer type. The X-axis cancer type abbreviations are described here. This summary of the cancer genome atlas (TCGA) was collated from firebrowse developed by the Broad Institute. The code used to produce these figures is available through github.
Kinase Domain Structure:
- Title: Crystal structure of the kinase MARK3/Par-1: T211A-S215A double mutant
- Resolution: 1.9
Associated Compounds:
- NA
View This Structure on RCSB PDB
Kinase Domain Structure:
- Title: Kinase and Ubiquitin-associated domains of MARK3/Par-1
- Resolution: 2.7
Associated Compounds:
- NA
View This Structure on RCSB PDB

This data stems from the differentiation of neural stem cells into fully functional neurons and glia, which requires precise regulation of diverse molecular pathways over time and space. As part of the Harvard Medical School Library of Integrated Network-based Cellular Signatures (LINCS) Program (NIH grant U54 HL127365, lincs.hms.harvard.edu), we used phospho-proteomics to assess changes during ReN VM cell differentiation. Depicted is the dark kinase of interest (black) and two reference kinases (blue and green) to aid interpretation of the values. More information on this work can be found on Synapse.
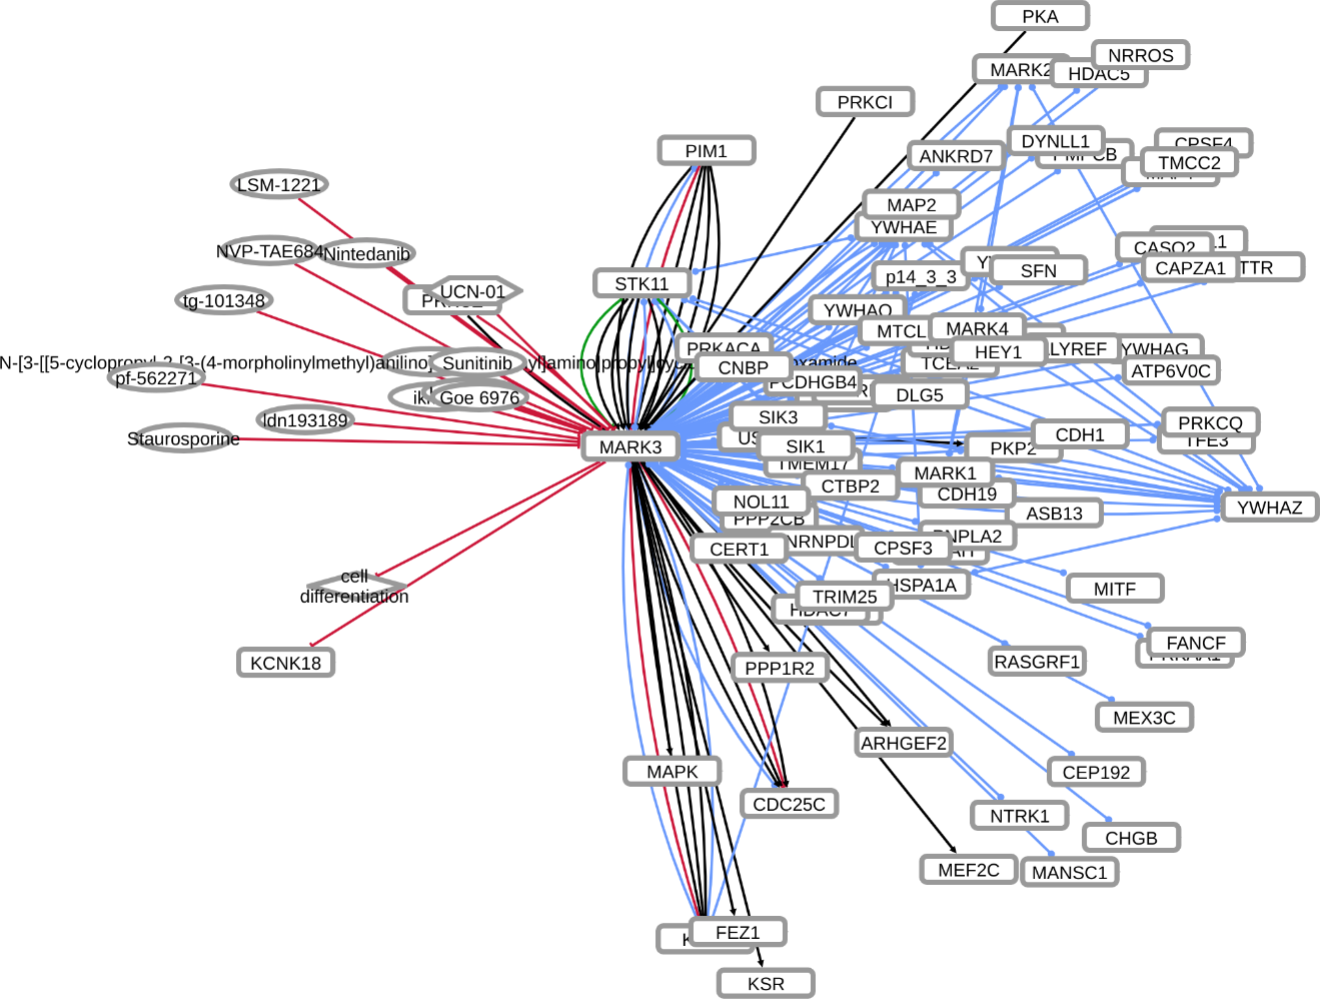
INDRA (Integrated Network and Dynamical Reasoning Assembler) is an automated model assembly system drawing from natural language processing systems and structured databases. It collects mechanistic and causal assertions, represents them in a standardized form (INDRA Statements), and assembles them into various modeling formalisms including causal graphs and dynamical models. More information on this work can be found on Github. In this particular figure, several interaction-types are depicted; physical complexes (blue), phosphorylation (black), and general up- or downregulation (green and red, respectively). Biomacromolecules are represented as squares, small molecule as circles, and biological processes and diamonds. The thickness of each line reflects a confidence score, with thicker lines higher in confidence.
Affinity Purification - Mass Spectrometry
The expression of kinases varies widely across the human tissues assayed by the GTEx project and the Human Proteome Map. To gain a better understanding of the kinase tissue distribution, we've created an application that describes and summarizes the expression of each dark kinase in the context of the rest of the kinome. This interactive window onto the full applications shows the data associated with MARK3. The graph summarizes the expression of the kinase across all the organ systems.
The full application can further explored at the Kinase Expression Data Application.
The Reactome Knowledgebase of Human Biological Pathways and Processes is a curated and peer-reviewed knowledgebase available online as an open access resource that can be freely used and distributed by all members of the biological research community. This view of the reactome database is focused on MARK3 and displays the pathways associated with MARK3.